Data Science Interview Questions Part-5 (Data Preprocessing)
Top-15 frequently asked data science interview questions and answers on Data preprocessing for fresher and experienced Data Scientist, Data analyst, statistician, and machine learning engineer job role.
Data Science is an interdisciplinary field. It uses statistics, machine learning, databases, visualization, and programming. So in this fifth article, we are focusing on Data Preprocessing questions.
Let’s see the interview questions.
1. What do you mean by feature engineering?
Features are the core characteristics of any prediction that impact the results. Feature engineering is the process of creating a new feature, transforming a feature, and encoding a feature. Sometimes we also use the domain knowledge to generate new features. It prepares the data that easily input to the model and improves model performance.
2. What do you mean by feature scaling or data normalization? Explain some techniques for feature scaling?
In feature scaling, we change the scale of features to convert it into the same range such as (-1,1) or (0,1). This process is also known as data normalization. There are various methods for scaling or normalizing data such as min-max normalization, z-score normalization(standard scaler), and Robust scaler.
Min-max normalization performs a linear transformation on the original data and converts it into a given minimum and maximum range.

z-score normalization (or standard scaler) normalizes the data based on the mean and standard deviation.

3. What are the missing values? and How do you handle missing values?
In the data cleaning process, we can see there are lots of values that are missing or not filled or collected during the survey. WE can handle such missing values using the following methods:
- Ignoring such rows or dropping such records.
- Fill values with mean, mode, and median.
- you can also fill values using mean but for different classes, the different means can be used.
- You can also fill the most probable value using regression, Bayesian formula, or decision tree, KNN, and Prebuilt imputing libraries.
- Fill with a constant value.
- Fill values manually.
4. What is an outlier? How you detect outliers in your data?
Outliers are abnormal observations that deviate from the norm. Outliers do not fit in the normal behavior of the data. We can detect outliers using the following methods:
- Box plot
- Scatter plot
- Histogram
- Standard Deviation or Z-Score
- Inter Quartile Range(IQR): values out of 1.5 times of IQR
- Percentile: you can select 99 percentile values and remove the
- DBSCAN
- Isolation forest, One-Class SVM
5. How you treat the outliers in your data?
We can treat outlier by removing from the data. After detecting outliers we can filter the outliers using Z-score, Percentile, or 1.5 times of IQR.
6. What do you mean by feature splitting?
Feature split is an approach to generate a few other features from the existing one to improve the model performance. for example, splitting name into first and last name.
7. How do you handle the skewed data columns?
We can handle skewed data using transformations such as square, log, square, square root, reciprocal (1/x), and Box-Cox Transform.

8. What do you mean by data transformation?
Data transformation consolidated or aggregate your data columns. It may impact your machine learning model performance. There are the following strategies to transform data:
- Data Smoothing using binning, or clustering
- Aggregate your data
- Scale or normalize your data for example scaling income column between 0 and 1 range.
- Discretize your data for example convert continuous age column into the range 0–10, 11–20, and so on. Or we can also convert the continuous age column into conceptual labels such as youth, middle, and senior.
9. How do you select the important features in your data?
We can select the important features using random forest, or remove redundant features using recursive feature elimination. Let’s all the categories of such methods.
- Filter Methods: Pearson Correlation, Chi-Square, Anova, Information gain, and LDA.
- Wrapper Methods: Forward Selection, backward elimination, Recursive feature elimination.
- Embedded Methods: Ridge and Lasso Regression
10. How will you perform feature engineering on a date column?
You can get lots of other important features from the date such as day of the week, day of the month, day of the quarter, and day of the year. Also, you can extract the date, month, and year. These all features can impact your prediction for example sales can be impacted by month or day of the week.
11. How will you handle the multi-collinearity? Explain with example.
Multicollinearity is a high correlation among two or more predictor variables in a multiple regression model. It is high intercorrelations or inter-association among the independent variables. It is caused by the inaccurate use of dummy variables and the repetition of the same kind of variable. Multicollinearity impacts change in the signs as well as in the magnitudes of the regression coefficients. We can detect multicollinearity using the Correlation coefficient, Variance inflation factor (VIF), and Eigenvalues. The easiest way to compute is the correlation coefficient. Let’s understand this with an example:
you have a dataset with the following columns:
- blood pressure (y = BP, in mm Hg)
- age (x1 = Age, in years)
- weight (x2 = Weight, in kg)
- body surface area (x3 = BSA, in sq m)
- duration of hypertension (x4 = Dur, in years)
- basal pulse (x5 = Pulse, in beats per minute)
- stress index (x6 = Stress)
suppose body surface area or weight have high correlation: Which variable needs to remove to overcome multicollinearity.
In this case, you can see the weight is easy to measure compared to body surface area(BSA). Removing a variable that has a high correlation with others depends upon domain knowledge.
12. What is heteroscedasticity? How will you handle the heteroscedasticity in the data?
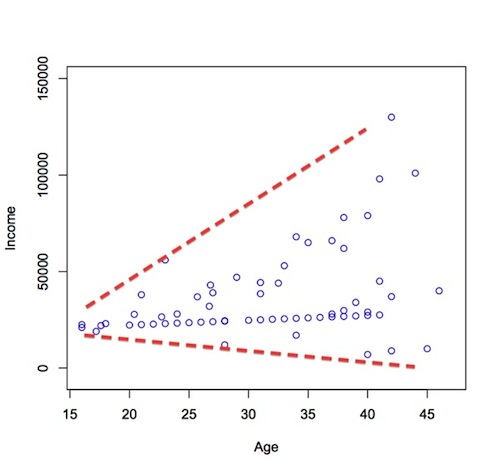
heteroscedasticity is a situation where the variability of a variable is unequal across the range of values of a second variable that predicts it. We can detect heteroscedasticity using graphs or statistical tests such as Breush-Pagan test and NCV test. You can remove heteroscedasticity Box-Cox transformations and log transformations. Box-Cox transformation is a kind of power transformation that transforms data into a normal distribution.

13. What are dummy variables?
In Regression analysis, we need to convert all the categorical columns into binary variables. Such variables are known as dummy variables. The dummy variable is also known as an indicator variable, design variable, Boolean indicator, categorical variable, binary variable, or qualitative variable. It takes only 0 or 1 to indicate the absence or presence of some categorical effect that may be expected to shift the outcome. K categories will takes K-1 dummy variables. For example, you can see the eye color and gender columns converted into one-hot encoded binary values.

14. What are the label and ordinal encodings?
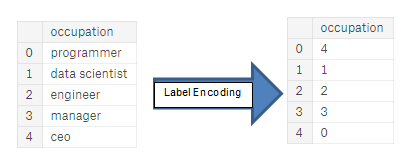
Label encoding is a kind of integer encoding. Here, each unique category value is replaced with an integer value so that the machine can understand.

Ordinal encodings is a label encoding with an order in the encoded values.
15. Explain one-hot encoding.
One hot encoding is used to encode the categorical column. It replaces a categorical column with its labels and fills values either 0 or 1. For example, you can see the “color” column, there are 3 categories such as red, yellow, and green. 3 categories labeled with binary values.

Summary
In this article, we have focused on the data preprocessing interview questions. In the next article, we will focus on the interview questions related to NLP and Text Analytics.
Data Science Interview Questions Part-6 (NLP and Text Analytics)


