
Data Science Interview Questions Part-3 (Classification)
Top-20 frequently asked data science interview questions and answers on c classification for fresher and experienced Data Scientist, Data analyst, statistician, and machine learning engineer job role.
Data Science is an interdisciplinary field. It uses statistics, machine learning, databases, visualization, and programming. So in this third article, we are focusing on basic data science questions related to classification techniques.
Let’s see the interview questions.
1. What are precision and recall?
Precision is the percentage of the correct positive predictions from total predicted positives. In other words, we can say, the percentage of retrieved items is correct. It is a measure of exactness. How much junk there is in your predicted positives.
The recall is the percentage of the correct positive predictions from total actual. . In other words, we can say, the percentage of the correct item received. It is a measure of completeness. How much of the true positives you found. When it is actually yes, how often is it predict yes?
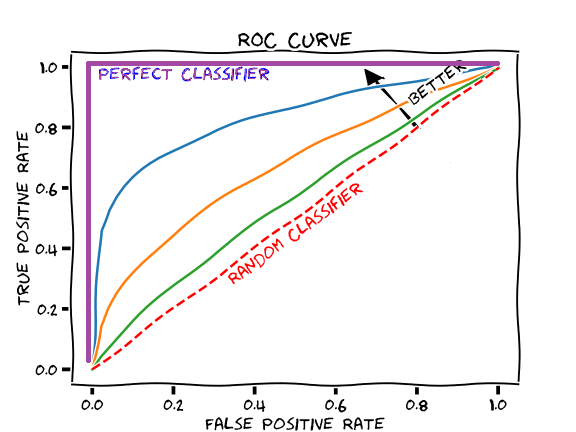
2. What are ROC and AUC?
ROC curve is a probability curve and AUC represents the degree or measure of separability. It tells how much the model is capable of distinguishing between classes or not.
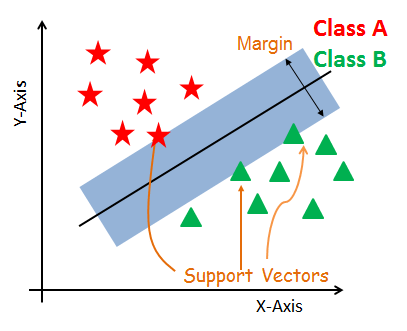
3. How do support vector machine algorithms work?
Support Vector Machines algorithm used in both types of classification and regression problems. SVM creates a hyperplane in multidimensional space to distinguish the different classes. SVM generates optimal hyperplane repeatedly and minimizes an error. The main concept of SVM is to discover a maximum marginal hyperplane(MMH) that suitably distinguishes the dataset into classes.
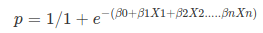
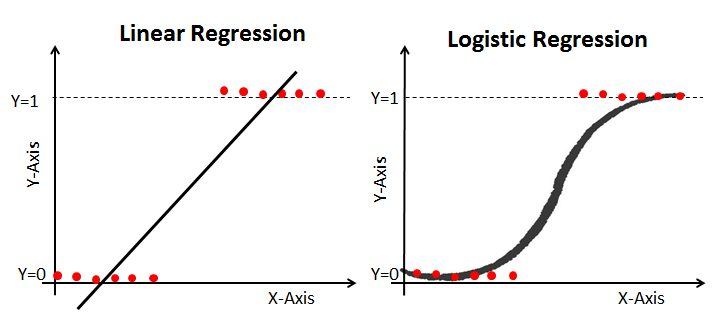
4. What is logistic regression?
Logistic Regression is one of the most simple, easy to implement, widely used classification techniques binary classification. It is used in various applications such as spam detection, churn prediction, and diabetes prediction. It uses the log of odds as the dependent variable and predicts the probability of occurrence of a binary event using a sigmoid function.
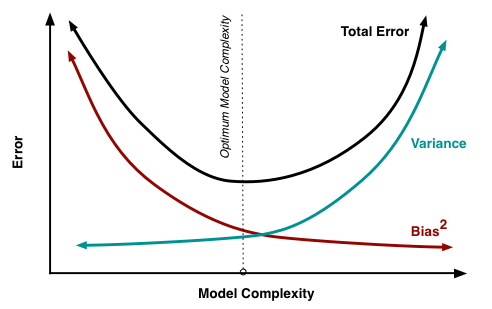
5. What is the bias-variance tradeoff?
Bias is the error that we captured. How far the predicted value from the actual value. Bias tends to decrease as model complexity increases. As complexity increases the chances of overfitting increase i.e. variance increases and bias decreases.
Variance is the variability of model prediction for a given data point or a value that tells us the spread of our data. A model with high variance pays a lot of attention to training data and does not generalize on the data which it hasn’t seen before.
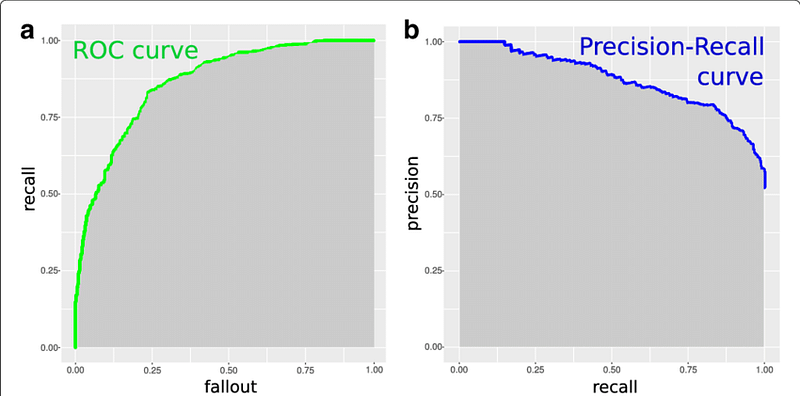
6. Compare ROC and Precision-Recall Curve.
ROC curve is derived from signal detection theory. A ROC curve for a given model represents the trade-off between the true positive rate (TPR) and the false positive rate(FPR). TPR or Recall is the ratio of positive tuples that are correctly labeled and FPR or (1-Specificity) is the ratio of negative tuples that mislabelled as positive.
The precision-recall curve shows the tradeoff between precision and recall. ROC curves recommended for balanced class problems while Precision recall curves recommended for the imbalance class problems.
7. What do you mean by overfitting and underfitting?
Underfitted models have a high bias, less complex, and less variance.
It can be overcome by increasing complexity and adding more parameters to the model.
The Overfitted models have less bias, highly complex, and high variance. It can be overcome by reducing complexity and introduce regularization.
8. What is the class imbalance problem?
In class imbalance problems, the main class of interest is rare. A data set distribution reflects a significant majority of the negative class and a minority positive class. For example, fraud detection applications, the class of interest (or positive class) is “fraud,” which occurs much less frequently than the negative “non-fraudulent” class. Another example, in medical data, there may be a rare class, such as “cancer.”
9. What is the difference between Bagging and Boosting?
Bagging is a Bootstrap Aggregation. It creates multiple models in a parallel manner. Bagging algorithms reduce the variance, suitable for high volume and low bias models. Examples of bagging are random forest and Extra tree algorithm.
Boosting creates models in a sequential manner. Boosting algorithms reduce the bias, suitable for low variance and high bias models. Example of boosting are XGBoost AdaBoost.
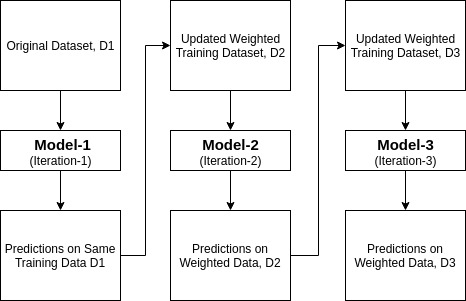
10. What is AdaBoost?
Ada-boost or Adaptive Boosting is one of the ensembles boosting classifiers. AdaBoost is an iterative ensemble method that combined multiple poorly performing classifiers so that you will get high accuracy strong classifier.
The basic concept behind Adaboost is to set the weights of classifiers and training data samples in each iteration such that it ensures the accurate predictions of unusual observations. Any machine learning algorithm can be used as a base classifier if it accepts weights on the training set.
11. What is XGBoost?
XGBoost stands for eXtreme Gradient Boosting. It trains models in isolation from one another and trained in a sequential manner. Here, each trained new model corrects the errors made by the previous ones using Gradient Descent. It is more flexible and faster. It is more prone to overfitting. It penalizes the model using regularization.
12. What are discriminative and generative models?
The discriminative models are based on the decision boundary. Such type of models uses conditional probability distribution. Examples, Log reg, SVM, NN, CRF. Discriminative models consume less time compare to generative models.
The generative models are based on the actual distribution of each class. Such type of model uses the joint probability. Examples, NB, Bayesian Network, HMM, clustering.
13. What is anomaly detection?
Anomaly detection is the process of discovering an unusual pattern in the event of a dataset. The term anomaly can also be referred to as an outlier. Outliers differ from normal events. Anomaly detection can be a supervised or unsupervised problem bu tin most of the situation it is like an unsupervised problem. For example, One-class SVM, Isolation forest, and Local Outlier Factor(LOF).
14. What are false positives and false negatives?
False positives are the negative tuples that were incorrectly labeled as positive but it is actually negative. False negatives are the positive tuples were incorrectly labeled as negative but actually, it is positive.
In the case of cancer prediction, false negatives are more important than false positives because it is worse saying someone does not have cancer but actually he has.
15. Which algorithm is better random forests or SVM and why?
Yes, a random forest is a better choice compared to a support vector machine.
- Random forest is faster to build compare to SVM.
- SVM is less scalable and requires more memory.
- Random forests determine feature importance.
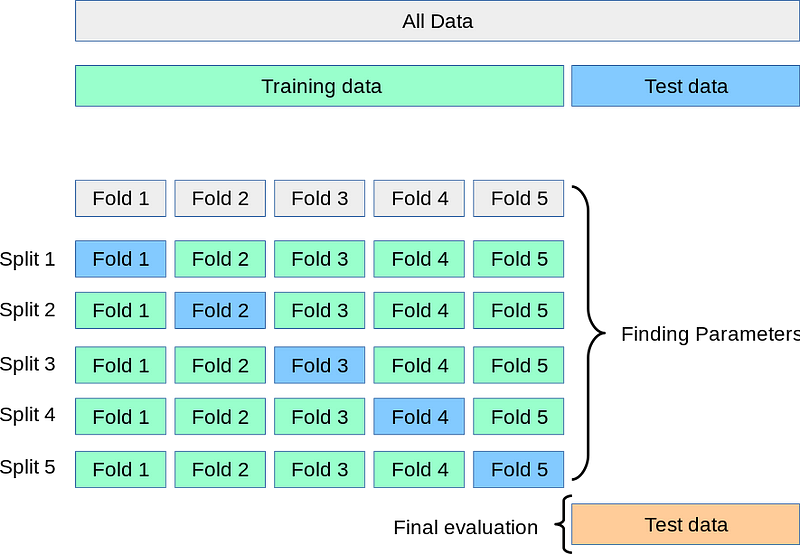
16. What is cross-validation?
Cross-validation or K-fold cross-validation is used to assess the model’s robustness and effectiveness. It is a kind of resampling technique to assess model performance. It also helps us to check whether our model is Under-fitting or Over-fitting.
k-fold cross-validation splits data into k parts or batches and in each iteration, it considers 1 batch for test and remaining for training purpose. This is how we will get accuracy on each batch and finally, we can check the variation or average accuracy. If the model is very similar to all the batches, then it is likely that it is a fairly accurate model.
17. Is a random forest a better model than a decision tree?
Yes, a random forest is better than a decision tree because the random forest is an ensemble bagging method it combines multiple decision trees and creates one combined classifier which is more robust and accurate.
18. What is a kernel? Explain the kernel trick?
SVM uses a kernel function to distinguish the classes. kernel converts the lower-dimensional space into the required higher dimensional space this method is known as the kernel trick. It is used to separate linear as well as nonlinear separation problems. we can try linear, polynomial, and RBF kernel.
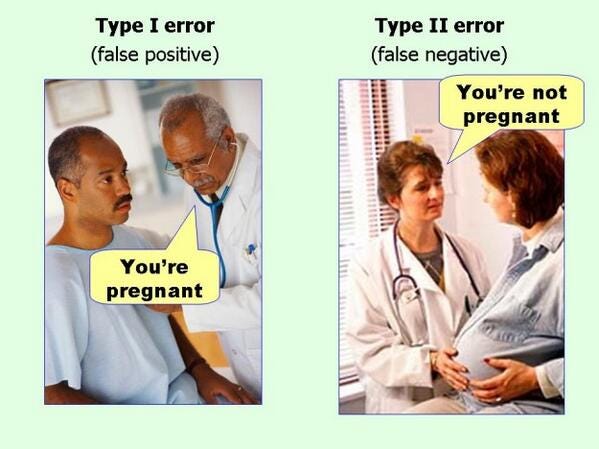
19. What is the difference between Type 1 and Type 2 errors?
Type 1 error is classified as a false positive. Here, incorrectly labeled as positive but it is actually negative. For example, False fire alarm. The alarm rings but there is no fire.
Type 2 error is classified as a false negative. Here, positive tuples were incorrectly labeled as negative but actually, it is positive.
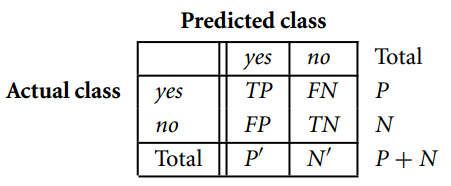
20. What is a confusion matrix?
A confusion matrix is a useful tool to assess and evaluate the machine learning classification model. It is a table of n*n, where n is the number of classes in the classifier.
Summary
In this article, we have focused on the classification technique interview questions. In the next article, we will focus on the interview questions related to unsupervised learning.