Data Science Interview Questions Part-2 (Regression Analysis)
Top frequently asked data science interview questions(Regression Analysis) and answers for fresher and experienced Data Scientist, Data Analyst, and Machine Learning Engineer job roles.
Data Science is an interdisciplinary field. It uses statistics, machine learning, databases, visualization, and programming. In the previous article (Data Science Interview Questions Part-1) in this series, we have focused on basic data science interview questions related to domain search. So in this second article, we are focusing on basic data science questions related to Regression Analysis.
Let’s see the interview questions.
1. What is linear and non-linear regression?
Regression analysis is a supervised statistical technique used to determine the relationship between a dependent variable and a series of independent variables.
The linear regression model follows the linear relationship between the dependent and independent variables. It uses a linear equation, Y = a +bx, where x is the independent variable and Y is the dependent variable. Linear regression is easy to use, and interpret. Non-linear regression doesn’t follow Y = a +bx equation. Non-linear regression is much more flexible in curve fitting. It can be represented as the polynomial of k degrees.
2. What are MSE and RMSE?
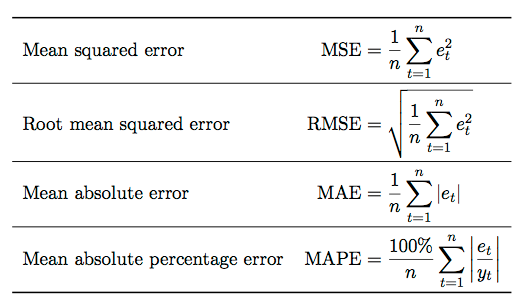
Mean Squared Error(MSE) is the average of squared errors of all values. Or in other words, we can say it is an average of squared differences between predicted and actual value.
RMSE (Root Mean Squared Error) is the square root of the average of squared differences between predicted and actual values.
RMSE increases are larger than MAE as the test sample size increases. In general, MAE is steady and RMSE increases as the variance of error magnitudes increases.
3. What are MAE and MAPE?
Mean Absolute Error(MAE) is the average of absolute or positive errors of all values. Or in other words, we can say it is an average of absolute or positive differences between predicted and actual value.
MAPE (Mean Absolute Percent Error) computes the average absolute error in percentage terms. It can be defined as the percentage average of absolute or positive errors.
4. What is the difference between R-square and Adjusted R-square?
R-square or coefficient of determination is the measure of the proportion of the variation in your dependent variable (Y) explained by your independent variables (X) for a linear regression model.
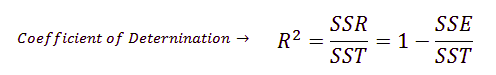
The main problem with the R-squared is that it will always be the same or increase with adding more variables. Here Adjusted R square can help. Adjusted R-square penalizes you for adding variables that do not improve your existing model.
5. What is the difference between Correlation and Regression?
correlation measures the strength or degree of relationship between two variables. It doesn’t capture causality. It is visualized by a single point.
Regression measures how one variable affects another. Regression is about model fitting. It captures the causality and shows cause and effect. It is visualized by line.
6. What is multicollinearity?
Multicollinearity can also be known as collinearity. It is a phenomenon where two or more independent variables are highly correlated i.e. one variable can be linearly predicted from the other variables. It measures the inter-correlations and inter-association among independent variables.
Multicollinearity is caused due to the inaccurate use of dummy variables or due to any variable which is computed from the other variable in the data.
It impacts regression coefficients and causes high standard errors. We can detect using the correlation coefficient, Variance inflation factor (VIF), and Eigenvalues.
7. What is VIF? How do you calculate it?
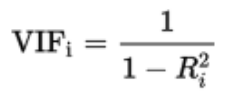
Variance inflation factors (VIF) measure how much the variance of an estimated regression coefficient is increased because of collinearity. It computes how much multicollinearity exists in a regression analysis.
It performs ordinary least square regression that has Xi as a function of all the other explanatory or independent variables and then calculates VIF using the formula:

8. What is heteroscedasticity?
Heteroscedasticity refers to the situation where the variability of a variable is unequal across the range of values of a second variable that predicts it. WE can detect heteroscedasticity using graphs or statistical tests such as Breush-Pagan test and NCV test.
9. What is a Box-Cox Transformation?
Box-cox transformation is a mathematical transformation of the variable to make it approximate to a normal distribution. Box-cox is used to transform skewed data into normally distributed data.
10. What are the basic assumptions of Linear Regression?
Linear regression has the following assumptions:
- Linearity: The relationship between the features and target.
- Homoscedasticity: The error term has constant variance.
- Multicollinearity: There is no multicollinearity between the features.
- Independence: Observations are independent of each other.
- Normality: the error(residuals) follows a normal distribution.
11. What is OLS?
The core objective of linear regression is to find coefficients(α and β) by minimizing the error term. The model tries to minimize the sum of squared errors. This process is known as OLS. The OLS(Ordinary Least Squares) method corresponds to minimizing the sum of square differences between the observed and predicted values.
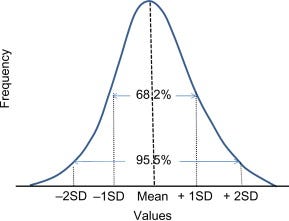
12. What do you mean by normal distribution?
A normal distribution is a bell-shaped curve. is a distribution that occurs naturally in many situations. For example, the bell curve is seen in tests like the SAT and GRE. The bulk of students will score the average ©, while smaller numbers of students will score a B or D.
The normal distribution is the most important probability distribution in statistics because it fits many natural phenomena. For example, heights, blood pressure, measurement error, and IQ scores follow the normal distribution. It is also known as the Gaussian distribution and the bell curve.
13. What are dummy variables?
A dummy variable is a categorical independent variable. In Regression analysis, such variables are known as dummy variables. It is also known as an indicator
variable, categorical variable, binary variable, or qualitative variable. n categories in a column always have n-1 dummy variables.
14. How random forest regressor works?
Random forest is a bagging algorithm that runs multiple decision trees independently in parallel. We select some samples from the data set and for each sample decision tree will be generated. In a classification problem, performs the majority voting on final predicted values of multiple trees. In a regression problem, finds the mean of the final predicted values from multiple decision trees.
15. What is Gradient Descent?
It is a first-order iterative optimization technique for finding the minimum of a function. It is an efficient optimization technique to find a local or global minimum.
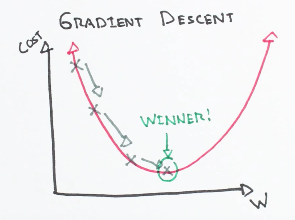
Types of Gradient Descent
- Full batch gradient descent uses a full dataset.
- Stochastic gradient descent uses a sample of the dataset.
16. What are the disadvantages of linear regression?
The main disadvantage of linear regression is the assumption of linearity. It assumes a linear relationship between the input and output variables and fails to fit complex problems. It is sensitive to noise and outliers. It gets affected by multicollinearity.
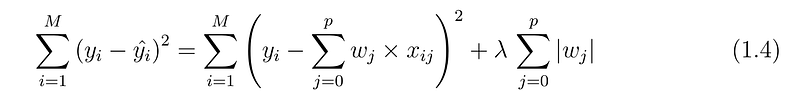
17. What is the use of regularisation? Explain L1 and L2 regularisations.
Regularization is used to handle overfitting problems. It tries to balance the bias and variance. It penalizes the learning for more complex and flexible models. L1 and L2 have Commonly used regularization techniques. L1 or LASSO(Least Absolute Shrinkage and Selection Operator) regression adds the absolute value of the magnitude of coefficient as a penalty term to the loss function.
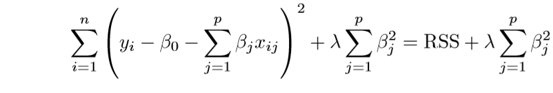
L2 or Ridge regression adds a squared magnitude of coefficient as a penalty term to the loss.
Summary
In this article, we have focused on the regression analysis interview questions. In the next article, we will focus on the interview questions related to the classification techniques.