Data Science Interview Questions Part-7(Statistics)
Top-25 frequently asked data science interview questions and answers on Statistics for fresher and experienced Data Scientist, Data analyst, statistician, and machine learning engineer job role.
Let’s see the interview questions.
1. What is the difference between inferential statistics and descriptive statistics?
Descriptive statistics describe the input data and provide initial findings for data. It will give the mean, median, standard deviation, etc. For example, the manager of a supermarket wants to see the waiting time for billing.
Inferential statistics allow us to make inferences from a smaller sample of data from the population. It is used when we have limited time, cost, and other constraints. For example, the LED bulb manufacturing firm wants to check the average working hours of LED bulbs. In this case, the firm can’t test all the bulbs they need to take a small sample of bulbs and infer the results from the sample for all the bulbs.
2. What are the standard deviation and standard variance?
Standard deviation is the average distance from the mean or variation from the mean. A small value of standard deviation shows closeness in data points while a larger value shows the higher scatteredness of data. Standard variance is the square of standard deviation. It also describes the data variation from the mean. For comparison purposes, the standard deviation will be preferred because its unit is the same as the mean.
3. What is exploratory data analysis?
EDA(Exploratory Data Analysis) is the most crucial step of the data analysis process. It provides an initial understanding of data. It discovers insights and answers to business queries and questions. It also assesses the quality of data and finds missing values and outliers.
4. What do you mean by the arithmetic mean, harmonic mean, and geometric mean?
The arithmetic mean is the average value of given data points. It can be expressed as the ratio of the sum of all the observations to the total number of observations. For example, the average of runs scored by a cricket player.
The harmonic mean is the reciprocal of the arithmetic mean of reciprocals. Average speed and flow of liquid are examples of harmonic mean.
The geometric mean multiplies the numbers together and then takes a square root. It offers a good application where units of the indicator are different. Compound interest from year to year is an example of a geometric mean.
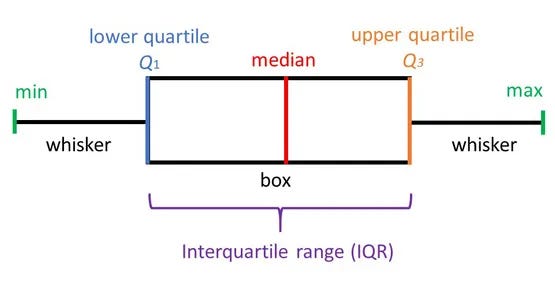
5. What is a boxplot?
Boxplot or Box-whisker plot is used to understand the distribution of a variable. This plot also shows the quartiles, minimum, maximum, and outliers. It uses a rectangular box or whiskers to show the quartile.
Minimum (or Lower Limit) = Q1–1.5 IQR
Maximum (or Upper Limit) = Q3 + 1.5 IQR
Any value that will be more than the upper limit or lesser than the lower limit will be considered as the outliers.
6. Can you give some examples of where to use the mean or where to use the median?
Mean is the average value of a set of observations. It is used when data is normally distributed. Median is the middle value of a given set of observations. It is used when data is the skewed or long tail. For example, Income variable, income is highly skewed in the real world. If you use mean then the value of the mean will be dominated by the outliers.
7. What is left skewness and right skewness?
Skewness describes the distribution symmetry. It shows the deviation from the normal distribution. Skewness can be left or right skewness. Left skewed or negative skewed has a tail towards the left side and right-skewed or positive-skewed has a tail towards the right side.
8. What is kurtosis?
Kurtosis measures the thickness of the tail. The high value of kurtosis means heavy-tailed which indicates more outliers. The low value of kurtosis means less tailed which means less number of outliers in the observations.
9. What is an outlier? How to detect and handle outliers?
Outliers are abnormal observations that deviate from the norm. Outliers do not fit in the normal behavior of the data. We can detect outliers using the following methods:
- Box plot
- Scatter plot
- Histogram
- Standard Deviation or Z-Score
- Inter Quartile Range(IQR): values out of 1.5 times of IQR
- Percentile: you can select 99 percentile values and remove the
- DBSCAN
- Isolation forest, One-Class SVM
10. What do you mean by correlation and covariance?
Covariance is used to quantify the relationship between a pair of variables. IT shows if we change one variable how it will impact the other. Covariance ranges from -infinity to + infinity.
Correlation also quantifies the relationship between two variables but it is normalized and ranges between -1 to +1. It also ensures that a certain degree between two variables. In other words, we can say covariance is boundary-less but the correlation has a boundary. It makes it easier when we compare the two results.
11. What is the Pareto principle?
The Pareto principle is also known as the 80/20 rule. It says that 80% of the results come from 20% of the effort. Eg. 80% of sales come from 20% of customers.
12. What is the difference between population and sample in inferential statistics?
In inferential statistics, the Population is the entire set of respondents and the sample is a subset from that entire set of respondents. Whenever we do any survey we select a few respondents to collect the data.
13. What is the difference between sample distribution and sampling distribution?
Sample distribution is the distribution of all the values of the sample and sampling distribution displays all the values of possible samples from the population.
14. What are the types of sampling techniques in statistics?
Sampling is of types: Probability and Non-probability Sampling. Probability sampling selects the samples randomly(with equal chances) and Non-probability samples select the samples non-randomly(with unequal chances). Sampling can be of the following types:
- Random Sampling: It selects respondents by chance.
- Cluster Sampling: It decides the population into smaller groups and then selects the entire group or cluster.
- Stratified Sampling: Population divided into unique groups and respondents selected from each stratum.
- Systematical Sampling: It selects every ’n’ respondents from the population.
- Convenience Sampling: It selects the respondents as available.
15. What is the advantage of using the standard normal distribution over the normal distribution?
Normal distribution fits into all kinds of real-life scenarios such as heights, exam scores, and blood pressure. The standard normal distribution is a specific distribution with a mean 0 and a standard deviation of 1. It is also known as the Gaussian distribution and the bell curve. Standardizing normal distribution makes it easier to compare with other metrics. It all boils down to the central limit theorem. The standard normal distribution uses Z values that can be easily compared and interpreted by a trained statistician.
16. What is a binomial distribution?
Binomial distribution has two possible outcomes Success or Failure (Yes or No). It is the probability of both outcomes over multiple experiments. Bernoulli distribution is the binomial distribution that has a value of n=1.
It has the following conditions:
- It has a fixed number of trials or observation
- The probability of success should be the same for each trial
- Each trial or observation must be independent
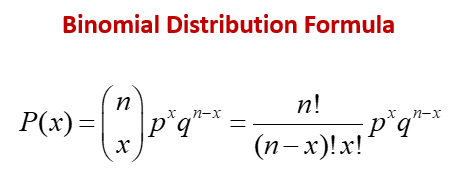
Here, p=probability of a success, q=probability of a failure, n-stands for the number of times the experiment runs.
17. What are some of the properties of a normal distribution?
Here are the following properties of the normal distribution:
- It is symmetric about the mean.
- mean=median=mode
It follows the empirical rule that finds what percentage of your data falls within a certain number of standard deviations.
18. Why do we conduct hypothesis testing?
The main objective of hypothesis testing is to determine the statistical significance in favor of a certain assumption. For example, We want to find statistical evidence that from a selected random sample of customers 15% will purchase the product. Similarly, you want to check the effectiveness of the Covid vaccine on the selected sample.
19. What is the central limit theorem?
The central limit theorem is a sampling distribution approach that states that with an increase in sample size distribution approaches to a normal. It means the mean of the sample gets closer to the population mean and the standard deviation of the sample will reduce.
20. What is the null and alternative hypothesis?
The hypothesis is the assumption that formulates a conclusion about the population. The null hypothesis is the exact opposite of what a researcher expects. An Alternative hypothesis is a statement used to contradict the null hypothesis.
21. What is the p-value?
A p-value is used to test a hypothesis testing. It helps us to accept or reject the null hypothesis. P-value provides evidence against the null hypothesis. The larger the p-value causes week evidence against the null hypothesis. It means a large value indicates acceptance of the null hypothesis or fail to reject the null hypothesis.
22. What is the difference between one tail and two tail hypothesis testing?
One-tailed hypothesis in unidirectional or one-sided tests because we can test effects in only one direction while Two-tailed hypothesis tests are also known as nondirectional and two-sided tests because it can test effects in both directions. The one-tailed test has less than(<) and greater than(>) conditions while the two-tailed test has an equal(=) sign.
23. What degrees of freedom (DF) in statistics?
Degree of freedom or DF is the number of independent variables required for performing an analysis. Variables that are dependent are not considered to be free. For instance, if we are calculating a sample variance using the sample mean, we lose degree of freedom because we’ve forced the sample mean to be a particular value.
It is mostly used in t-distribution and not with the z-distribution. If DF will increase then t-distribution will be closer to normal distribution.
24. What is the difference between the confidence level and the significance level?
A statistical significance test provides an outcome yes/no, reject/fail to reject. significance level (or alpha )is the probability of rejecting the Null Hypothesis and expressed as a percentage.
Significance level = 1 − Confidence level
The confidence level tells us how sure we can be and is expressed as a percentage. or A confidence interval is an interval within which you are confident the true value lies to some degree of accuracy.
For example, a 95% confidence level indicates 95% certainty and a 5% significance level indicates the risk of concluding that a difference exists when there is no actual difference.
25. What does it mean by bell curve distribution and Gaussian distribution?
The bell curve or bell-shaped term is used for normal distribution which is also known as Gaussian distribution. The normal distribution is a type of continuous probability distribution. It is symmetric from the mean.
Summary
In this article, we have focused on Statistics interview questions. In the next article, we will focus on the interview questions related to Deep Learning.
Data Science Interview Questions Part-8(Deep Learning)