
Outlier Detection using Isolation Forests
For a dataset, an outlier is a data point that behaves differently from the other data points. Outliers cause huge performance losses in Machine Learning algorithms. So to obtain an optimal Machine Learning model, outliers need to be taken care of – either by removing the outlier points or modifying them to some reasonable value for the dataset. For either of these actions, it is necessary to detect the outliers first.
Outliers greatly impact the mean, variance, and standard deviation of the dataset. This can result in an increased error in classification or regression models. Thus, it becomes very important to detect and deal with outliers.
In this article, we will look at the use of Isolation Forests for the detection of outliers in a dataset.
Isolation Forests
Isolation forest is an unsupervised learning algorithm for outlier detection. The algorithm is based on Decision Trees.
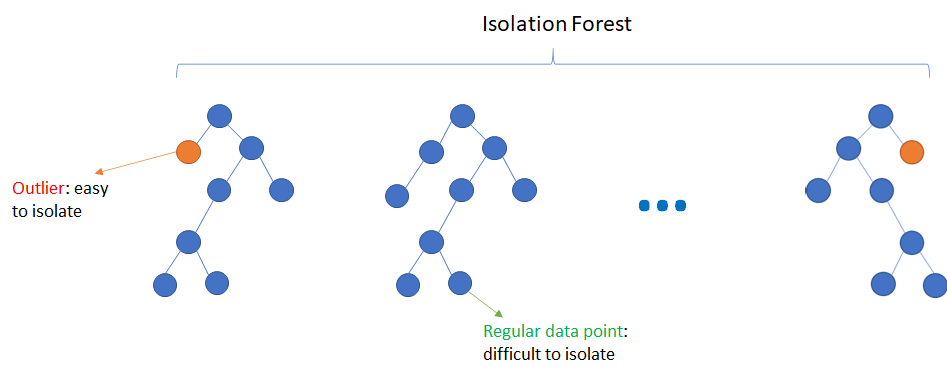
The algorithm isolates the observations by selecting a feature randomly. It then randomly chooses a split value between the maximum and minimum values of the feature selected. This can be represented by a decision tree structure. The path length from root to leaf in such decision trees is a measure of normality of the point. This path length is equivalent to the number of splittings required to isolate a sample. Outliers are a minority as compared to other regular data points. In the feature space, they lie further away from the regular data points. Hence, using such kind of decision tree and random partitioning, these points should be identified closer to the root of the tree. This is because outliers have shorter average path length. When several such random decision trees are aggregated into a forest, they most likely produce shorter path lengths for outlier points.
Isolation Forests is a fast algorithm and also requires less memory as compared to other outlier detection algorithms. The algorithm can also be scaled for handling high-dimensional datasets.
Example in Python
Outlier detection can be done in Python using sklearn’s function sklearn.ensemble.IsolationForest(). Let’s look at a simple example for the following data:
| import pandas as pd # creating the dataset data = [[1,4], [2,2], [3,4], [4,4], [2,1], [2,8], [4,3], [20,30], [5,1], [2,6], [1,2], [6,6], [15,25], [7,3], [5,5], [6,1], [5,1], [18,21], [7,2], [3,3], [5,6], [3,8]] df = pd.DataFrame(data, columns=[‘x’, ‘y’]) |
Let’s visualize this data:
| import seaborn as sns sns.scatterplot(x=’x’, y=’y’, data=df) |
Output:
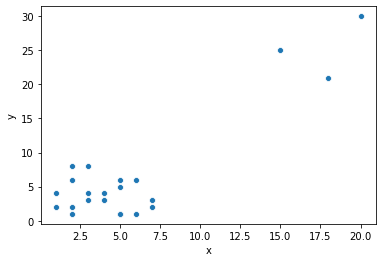
We can see that most of the data points are clustered together, while there are a few points, such as [20,30] which are outliers (or anomalies) for this data.
Let’s detect the outliers in this data using Isolation forest:
| from sklearn.ensemble import IsolationForest isolation_forest = IsolationForest(n_estimators=200, contamination=0.1).fit(df) |
n_estimators is the number of base estimators in the ensemble. Its default value is 100. contamination is the proportion of outliers in the dataset. It defines the threshold on the scores of the samples. By default, it is ‘auto’, but we can also set a value, as in this case = 0.1
fit() trains the algorithm and finds the outliers. Use the predict() method to find the outliers. The outliers detected are assigned a value of -1, while the other points are assigned a value of 1. We can get the outlier points as:
| outliers = isolation_forest.predict(df) print(df[outliers == -1]) |
Output:
| x y 7 20 30 12 15 25 17 18 21 |
We can see that the outliers are detected.
Summary
In this article, we looked at Outlier Detection using Isolation Forests. In the next article, we will focus on XGBoost Algorithm using Python.