K-Means Clustering
k-Means Clustering is the Partitioning-based clustering method and is the most popular and widely used method of Cluster Analysis. The unsupervised learning method works on multidimensional data.
k-Means is a very fast and efficient algorithm. It is simple and easy to understand.
k-means is a centroid-based method, where the number k is defined to refer to the number of centroids (or clusters, as centroid is the center of the cluster) in the data. It then assigns the data points to the nearest cluster. The data points within a cluster should be similar to each other. Hence, we need to minimize the distance between the data points within a cluster using the distance metrics.
In K-means, the ‘means’ implies averaging of the data to find the centroid and thus define the cluster.
Algorithm
- Randomly select k data points (called ‘means’) and initialize them.
- For each data point, calculate its distance from each of the clusters’ center
- Assign the data point to the closest mean
- Update the coordinates of the mean (i.e., the average of all data points in that cluster)
- Repeat the process for the specified number of iterations
Halting Criteria
There are certain stopping criteria that can be used to stop the k-Means algorithm:
- The defined number of iterations are reached
- No data points are getting reassigned, i.e., points remain in the same cluster
- There is no change in the value of centroids of the newly formed clusters
Example
Let’s take a look at an example of k-Means Clustering in Python. The function kMeans() is present in Python’s sklearn library.
Consider the following data:
| from sklearn.datasets import make_blobs from sklearn.preprocessing import StandardScaler # create the dataset centers = [[2,1], [-2,2], [-2,-2]] x, y = make_blobs(n_samples=300, centers=centers, cluster_std=0.6) # normalization of the values x = StandardScaler().fit_transform(x) |
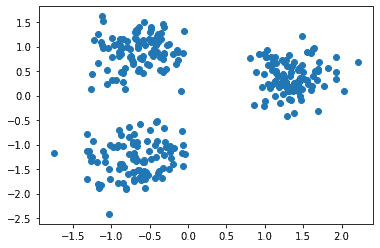
Here, we are creating data with three clusters. The function used to create these data points is the make_blobs() function. The parameters for this function for our data are – 300 sample data points, the standard deviation of a cluster is 0.6, the centers are as defined in the code.
We can visualize these data points using matplotlib, as:
| import matplotlib.pyplot as plt plt.scatter(x[:,0], x[:,1]) plt.show() |
The scatter plot is:
Now, let’s apply the k-Means algorithm to the above data points. The python code to do so is:
| from sklearn.cluster import KMeans kmeans = KMeans(n_clusters=3).fit(x) |
Here, for the k-Means algorithm, we have specified the number of clusters = 3.
Let’s visualize how the points are classified in the clusters:
| y2 = kmeans.predict(x) plt.scatter(x[:, 0], x[:, 1], c=y2) plt.show() |
The scatter plot is:
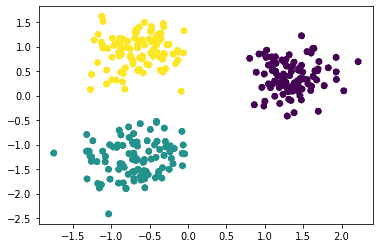
We can see that the algorithm has identified three clusters.
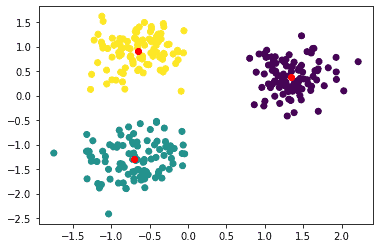
We can also view the centers of these clusters, as:
| kcenter = kmeans.cluster_centers_ plt.scatter(x[:, 0], x[:, 1], c=y2) plt.scatter(kcenter[:, 0], kcenter[:, 1], color=’red’) plt.show() |
The above code plots the center points in red, as:
Summary
In this article, we focused on K-means Clustering. In the next article, we will look into a Spectral Clustering.