Text Clustering: Grouping News Articles in Python
Learn how to cluster news documents using Text Clustering.
In this age of information, human activities produce lots of data from various sources social media, websites, government operations, industry operations, digital payments, blogging, and vlogging. Most of the communication is happening via video and textual data. textual data is mostly generated from blogging, tweets, feedback, reviews, chat, social media posts, emails, and websites. Businesses and governments want to organize this unstructured data. In this tutorial, we will focus on one such NLP technique Text Clustering. Text Clustering will help data professionals to categorize the information in an unsupervised manner.
In this tutorial, we are going to cover the following topics:
Text Clustering
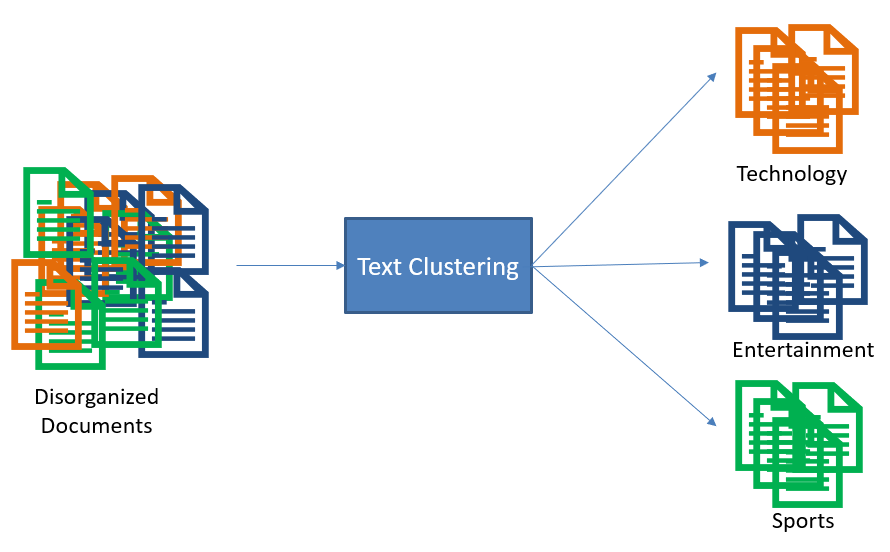
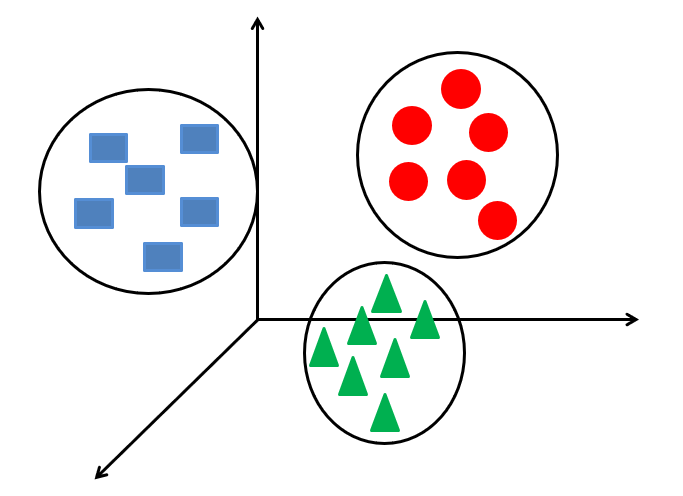
Text Clustering is a process of grouping most similar articles, tweets, reviews, and documents together. Here each group is known as a cluster. In clustering, documents within-cluster are similar and documents in different clusters are dissimilar. There are various clustering techniques are available such as K-Means, DBSCAN, Spectral clustering, and hierarchical clustering. Clustering is known as the data segmentation method. It partitions the large data sets into similar groups. Clustering can also be utilized in outlier detection problems such as fraud detection and monitoring of criminal activities.
Text Clustering is a broadly used unsupervised technique in text analytics. Text clustering has various applications such as clustering or organizing documents and text summarization. Clustering is also used in various applications such as customer segmentation, recommender system, and visualization. Text mining or analytics techniques need text to be converted into some type of vectors such as Bag of Words(BoW), Term Frequency-Inverse Document Frequency (TF-IDF), Word2Vec, Doc2Vec, Sent2Vec, USE, Skip-thoughts, or other transformers.
K-Means Clustering
K-means is one of the simplest and most widely used clustering algorithms. It is a type of partitioning clustering method that partitions the dataset into random segments. K-means is a faster and more robust algorithm that generates spherical clusters. It requires the number of clusters as input at the beginning.
K-means algorithms take input data and a predefined number of clusters as input. K-means algorithm works in the following steps:
1. It selects k random records as the center of clusters for the first iteration.
2. It allocates the records to the nearest center value cluster.
3. It computes the new cluster center by finding the mean of all the records.
Repeat steps 2 and 3 until there is no change in the cluster value.
The k-means method does not guarantee convergence to the global solution. It results may depend upon the initial cluster center. The k-means method is not suitable for finding non-convex clusters and nominal attributes. The predefined number of clusters can be seen as a disadvantage.
Perform clustering on the News dataset
Let’s first load the dataset. In our example below we are using the 20newsgroup dataset that is available in Scikit-learn datasets. This dataset consists article of 20 groups but in our example, we are filtering only for two categories soc.religion.christian and comp.graphics. Lets load dataset for train and test data.
from sklearn.datasets import fetch_20newsgroups

categories = ['soc.religion.christian',
              'comp.graphics']
# Load Data
twenty_train = fetch_20newsgroups(subset='train', categories=categories, shuffle=True, random_state=42)
twenty_test = fetch_20newsgroups(subset='test', categories=categories, shuffle=True, random_state=42)

# Check number of records in training and testing data
len(twenty_train.data),len(twenty_test.data)
Output: (1183, 787)
After loading the data, now it’s time to generate the features using TF-IDF vectorization available in Scikit-learn.
# TF-IDF Feature Generation
from sklearn.feature_extraction.text import TfidfVectorizer
from nltk.tokenize import RegexpTokenizer

# Initialize regex tokenizer
tokenizer = RegexpTokenizer(r'\w+')

# # Vectorize document using TF-IDF
tf_idf_vect = TfidfVectorizer(lowercase=True,
                        stop_words='english',
                        ngram_range = (1,1),
                        tokenizer = tokenizer.tokenize)

# Fit and Transfrom Text Data
X_train_counts = tf_idf_vect.fit_transform(twenty_train.data)

# Check Shape of Count Vector
X_train_counts.shape
Output: (1183, 22690)
Let’s perform k-means clustering from the Scikit-learn library and make 2 partitions in the dataset because this dataset has only types o articles that we already know. If we don’t know this then we should try with Elbow Method.
# Import KMeans Model
from sklearn.cluster import KMeans

# Create Kmeans object and fit it to the training data
kmeans = KMeans(n_clusters=2).fit(X_train_counts)

# Get the labels using KMeans
pred_labels = kmeans.labels_
Evaluate Clustering Performance
After clustering, we can evaluate the clustering using Davies-Bouldin Index and Silhouette Score. We can compare these scores with other clustering methods and compare which one is better. we can also verify results using Wordcloud and understand the clustering by observing wordcloud keywords.
from sklearn import metrics
# Compute DBI score
dbi = metrics.davies_bouldin_score(X_train_counts.toarray(), pred_labels)

# Compute Silhoutte Score
ss = metrics.silhouette_score(X_train_counts.toarray(), pred_labels , metric='euclidean')

# Print the DBI and Silhoutte Scores
print("DBI Score: ", dbi, "\nSilhoutte Score: ", ss)
Evaluate Clustering Performance using WordCloud
In the previous section, we evaluated the cluster using measures such as Davies-Bouldin Index and Silhouette Score. We can also verify the results using wordcloud by observing the frequent keywords available in wordcloud plot.
# Import WordCloud and STOPWORDS
from wordcloud import WordCloud
from wordcloud import STOPWORDS
# Import matplotlib
import matplotlib.pyplot as plt


def word_cloud(text,wc_title,wc_file_name='wordcloud.jpeg'):
    # Create stopword list
    stopword_list = set(STOPWORDS)

    # Create WordCloud
    word_cloud = WordCloud(width = 800, height = 500,
                           background_color ='white',
                           stopwords = stopword_list,
                           min_font_size = 14).generate(text)

    # Set wordcloud figure size
    plt.figure(figsize = (8, 6))

    # Set title for word cloud
    plt.title(wc_title)

    # Show image
    plt.imshow(word_cloud)

    # Remove Axis
    plt.axis("off")

    # save word cloud
    plt.savefig(wc_file_name,bbox_inches='tight')

    # show plot
    plt.show()
import pandas as pd
df=pd.DataFrame({"text":twenty_train.data,"labels":pred_labels})
for i in df.labels.unique():
new_df=df[df.labels==i]
text="".join(new_df.text.tolist())
word_cloud(text,twenty_train.target_names[i], twenty_train.target_names[i]+'.jpeg')Output:
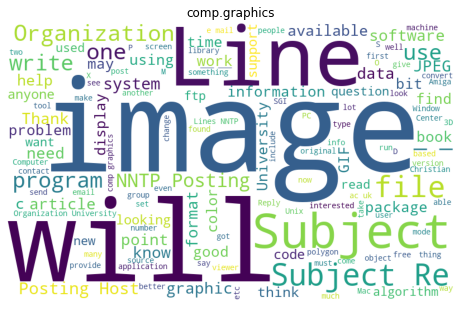
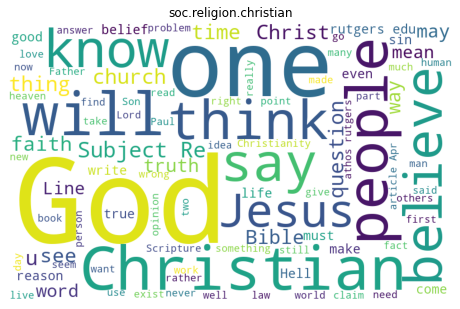
In the above two wordcoud, we can see that the first wordcloud is showing computer graphics-related keywords and the second wordcloud is showing religion-related. So our clustering performance is looking good in these wordclouds.
Summary
Congratulations, you have made it to the end of this tutorial!
In this article, we have learned Text Clustering, K-means clustering, evaluation of clustering algorithms, and word cloud. We have also focused on news article clustering with k-means and feature engineering with TF-IDF using the Scikit-learn package. If you want to learn NLP in detail, check out this link for more such articles.