
Evaluating Clustering Methods
Predicting optimal clusters is of utmost importance in Cluster Analysis. For a given data, we need to evaluate which Clustering model will best fit the data, or which parameters of a model will give optimal clusters. We often need to compare two clusters or analyze which model would be optimal to deal with outliers.
Different performance and evaluation metrics are used to evaluate clustering methods. In this article, we will look at some of these evaluation metrics.
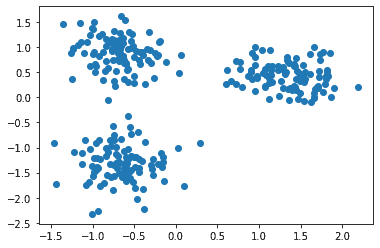
Consider the following data:
| from sklearn.datasets import make_blobs from sklearn.preprocessing import StandardScaler # create the dataset centers = [[2,1], [-2,2], [-2,-2]] x, y = make_blobs(n_samples=300, centers=centers, cluster_std=0.6) # normalization of the values x = StandardScaler().fit_transform(x) import matplotlib.pyplot as plt plt.scatter(x[:,0], x[:,1]) plt.show() |
The data is:
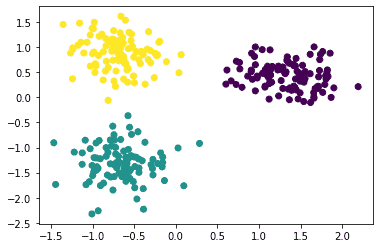
Now let’s apply the k-Means clustering on this data, as:
| # k-means clustering from sklearn.cluster import KMeans kmeans = KMeans(n_clusters=3).fit(x) # storing labels labels = kmeans.labels_ y2 = kmeans.predict(x) plt.scatter(x[:, 0], x[:, 1], c=y2) plt.show() |
The clusters are:
Changing the model parameters will give different scores for the various evaluation metrics. This could be used to choose optimal parameters and arrive at an optimal model. For now, let’s see how to use the various evaluation metrics on this model.
DBI
DBI stands for Davies Bouldin Index. It is an internal evaluation method for evaluating clustering algorithms. Lower the value of this metric better is the clustering algorithm. The evaluation of how well the clustering is done by using features inherent to the dataset.
Where k is the number of clusters. ∆Ci is the distance within the cluster Ci. δ(Ci, Cj) is the distance between the clusters Ci and Cj.
To calculate the DBI for the above kMeans clustering model, the python code is:
| from sklearn.metrics import davies_bouldin_score print(davies_bouldin_score(x, labels)) |
Output:
| 0.36263806390416436 |
Silhouette Index
The Silhouette score is the measure of how similar a data point is to its own cluster as compared to other clusters. A higher Silhouette score value indicates that the data point is better matched to its own cluster and badly matched to other clusters. The best score value is 1 and -1 is the worst.
Silhouette coefficient for a sample is defined as:
Where a is the average intra-cluster distance, and b is the average nearest-cluster distance. The Silhouette score is the mean of all such samples.
To calculate the Silhouette Index on the above kMeans Clustering model, the Python code is:
| from sklearn.metrics import silhouette_score print(silhouette_score(x, labels)) |
Output:
| 0.7310985097820031 |
CHS
CHS stands for Calinski and Harabasz Score (also known as Variance Ratio Criterion). This metric is the ratio of intra-cluster dispersion and inter-cluster dispersion.
To calculate the CHS for the above kMeans clustering model, the python code is:
| from sklearn.metrics import calinski_harabasz_score print(calinski_harabasz_score(x, labels)) |
Output:
| 1381.0084715045177 |
Rand Score
The Rand score is the measure of similarity between two clusters, considering all pairs of samples and using the count of the sample pairs that are assigned in the same or different clusters in the original and predicted cluster. The sklearn function for doing so is adjusted_rand_score() where the Rand score (RS) is adjusted to create Adjusted Rand Score (ARS), as:
It returns a value of 1.0 for identical clusterings and 0.0 for random labeling. To calculate the Rand score for the above kMeans clustering model, the python code is:
| from sklearn.metrics import adjusted_rand_score print(adjusted_rand_score(y, labels)) |
Output:
| 1.0 |
Jaccard Score
Jaccard Score is defined as the size of the intersection of two labeled sets divided by the size of the union of those two sets. It is a similarity coefficient score that is used to compare a set of predicted labels to the corresponding set of labels in the original value of y.
To calculate the Jaccard score for the above kMeans clustering model, the python code is:
| from sklearn.metrics import jaccard_score print(jaccard_score(y, y2, average=None)) |
Output:
| [1. 0. 0.] |
Since, this is the multiclass case, the average should be specified as None, ‘micro‘, ‘macro‘, or ‘weighted‘. None returns the scores for each class. Other three determine the type of averaging which is to be performed on the data. ‘Micro’ counts the total true positives, false negatives, and false positives for calculating the metrics globally. ‘Macro’ finds the unweighted mean by calculating metrics for each label. ‘Weighted’ calculates metrics for each label and the average which is weighted by support. For binary class ‘binary’ is used.
So, for example, using the ‘micro’ option for the above kMeans model:
| from sklearn.metrics import jaccard_score print(jaccard_score(y, y2, average=‘micro’)) |
Output:
| 0.2 |
Summary
In this article, we looked at various Clustering evaluation methods. In the next article, we will focus on Dimensionality Reduction using PCA.